
HOW TO DO THIS SURVEY:
- Read this page in full
- Click the "take survey" link at the bottom
- A new page will open with the survey
- Leave this page open if you like, to refer back to it
- Answer all the questions... click submit. You're done!
- We might give you a quick call (5 minutes) afterwards, to ask you for some extra detail on your answers
A New Business performance tool
The BizDojo is gathering feedback about a new, web-based tool for small businesses.
The tool has two main features:
- Shows you how your customers feel about you
- Helps you measure financial performance
The key difference between this tool and others is that it allows your business to compares performance against your industry averages.
To do this, it tracks the performance of many businesses in your industry and region. This is done anonymously, and is averaged to maintain privacy and security.
How the Tool Works:
- The tool would be provided by your bank, and viewed with your internet banking login for easy access
- It connects to your online banking or Xero account to get financial data, so you shouldn’t have to do any extra work
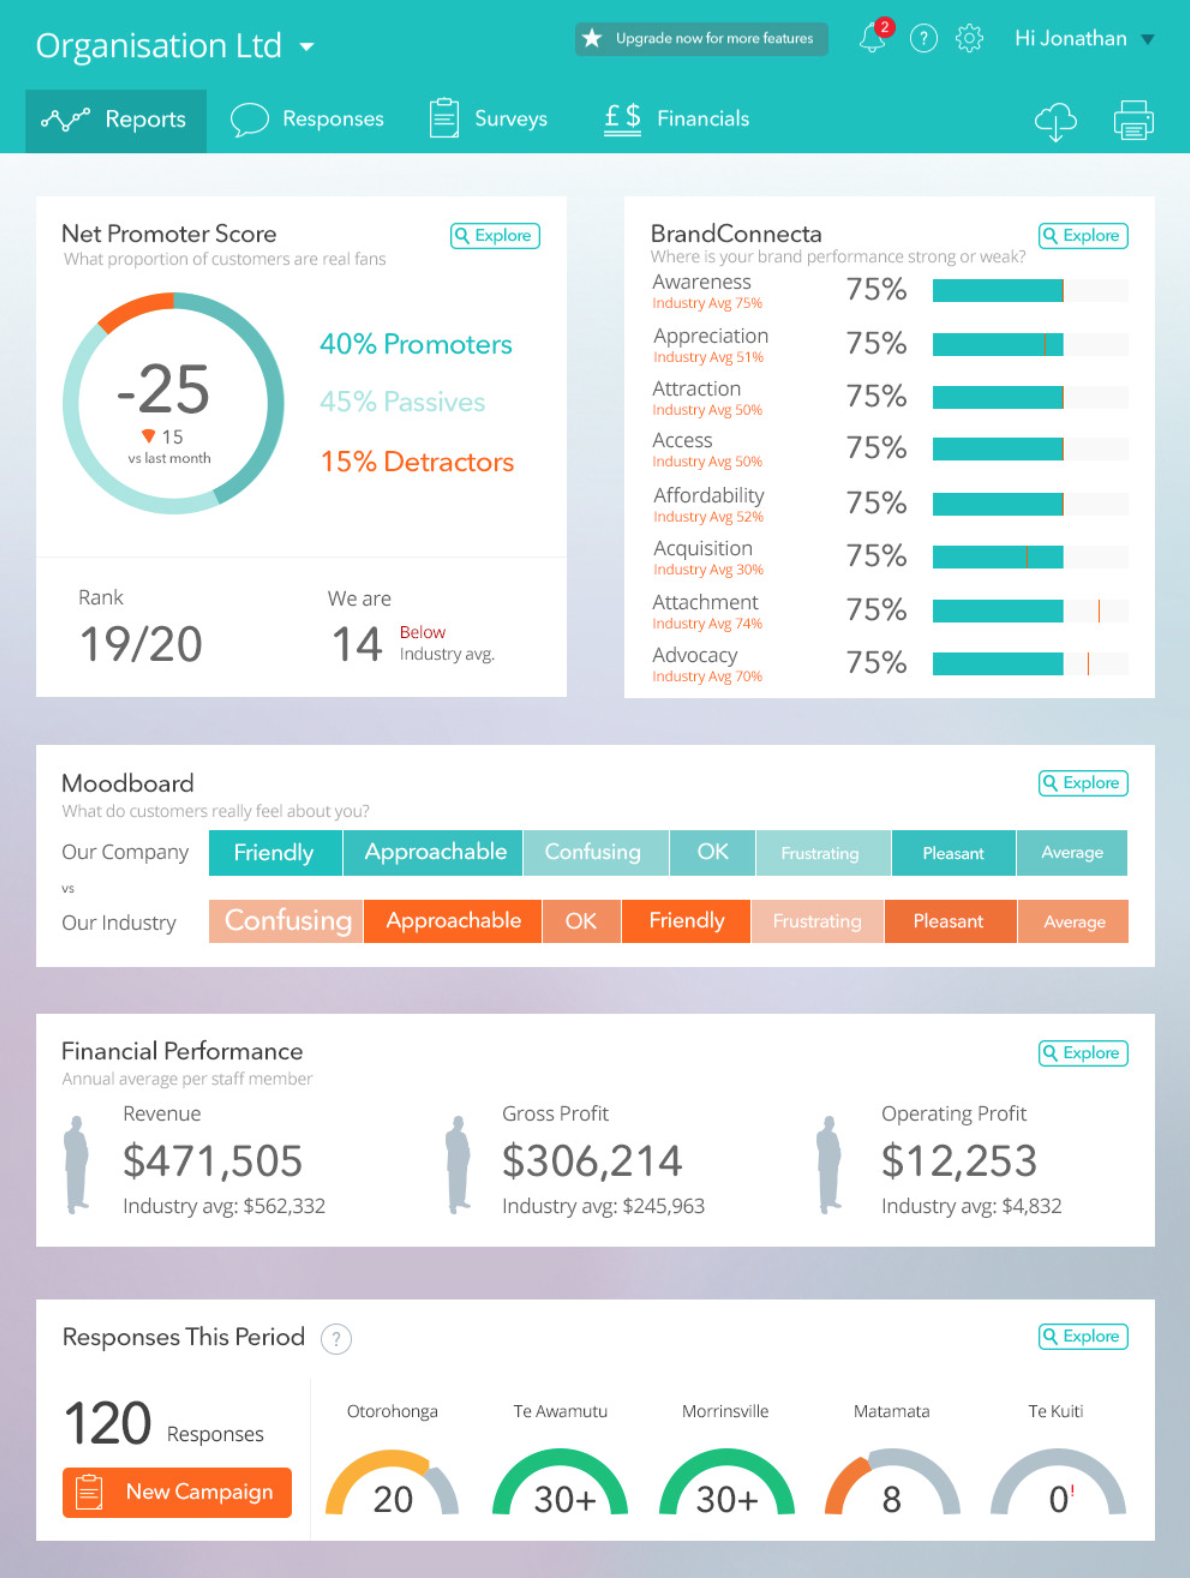
Figure 1: The main "Dashboard" of the tool.
FEATURE 1:
HOW CUSTOMERS FEEL ABOUT YOU
This feature helps you understand how your customers feel about you, also called “customer sentiment”.
The main graph shows a number called your “net promoter score” (NPS).
This tells you how likely people are to recommend your business to others.
It is calculated using the percentage of people who would definitely recommend you (your “promoters”), minus the percentage of people who would not (your “detractors”)
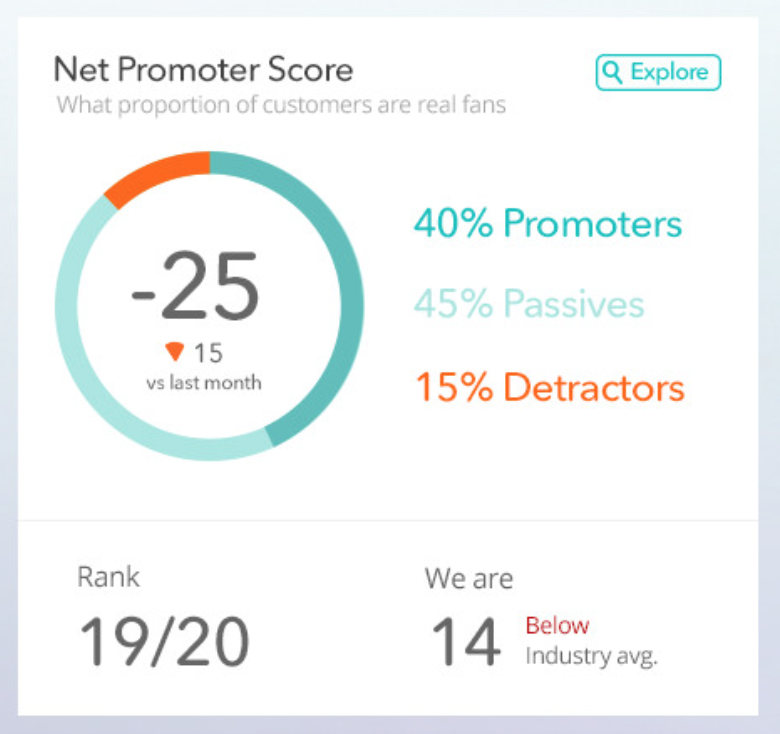
Graph 1: Net Promoter Score
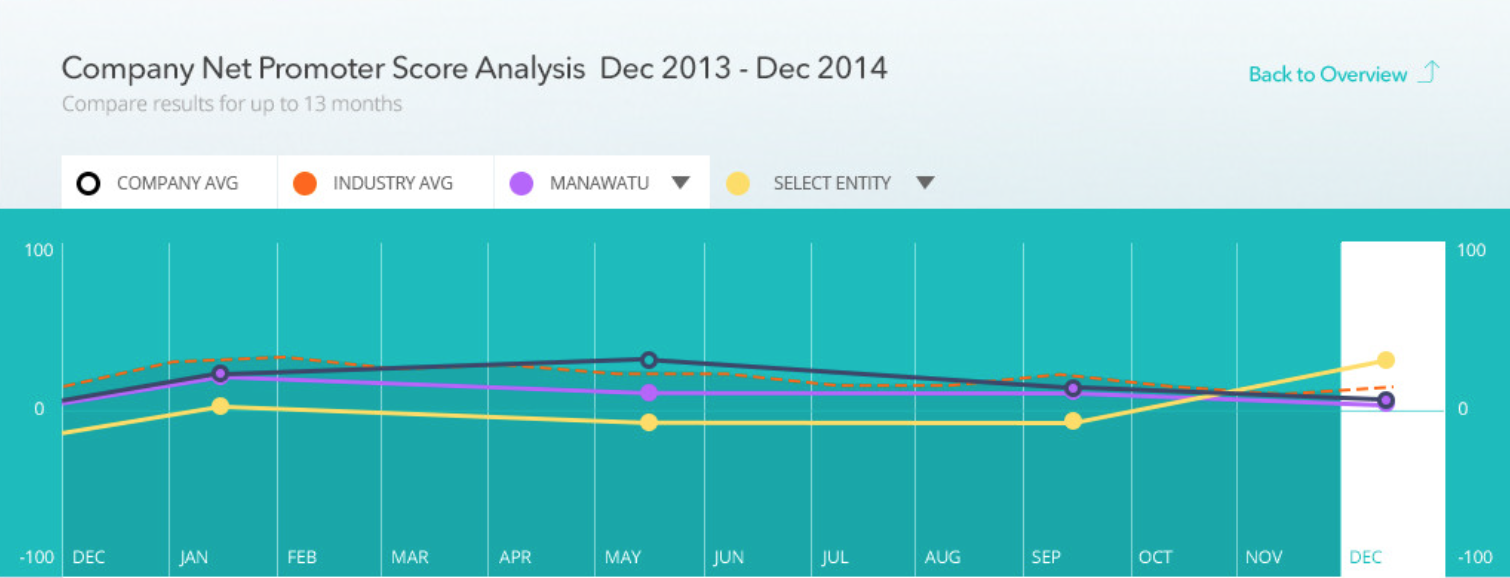
Graph 2: Your net promoter score over time
see how your net promoter score changes over time
You can see your NPS from month to month, and compare it to your industry’s average (the orange line).
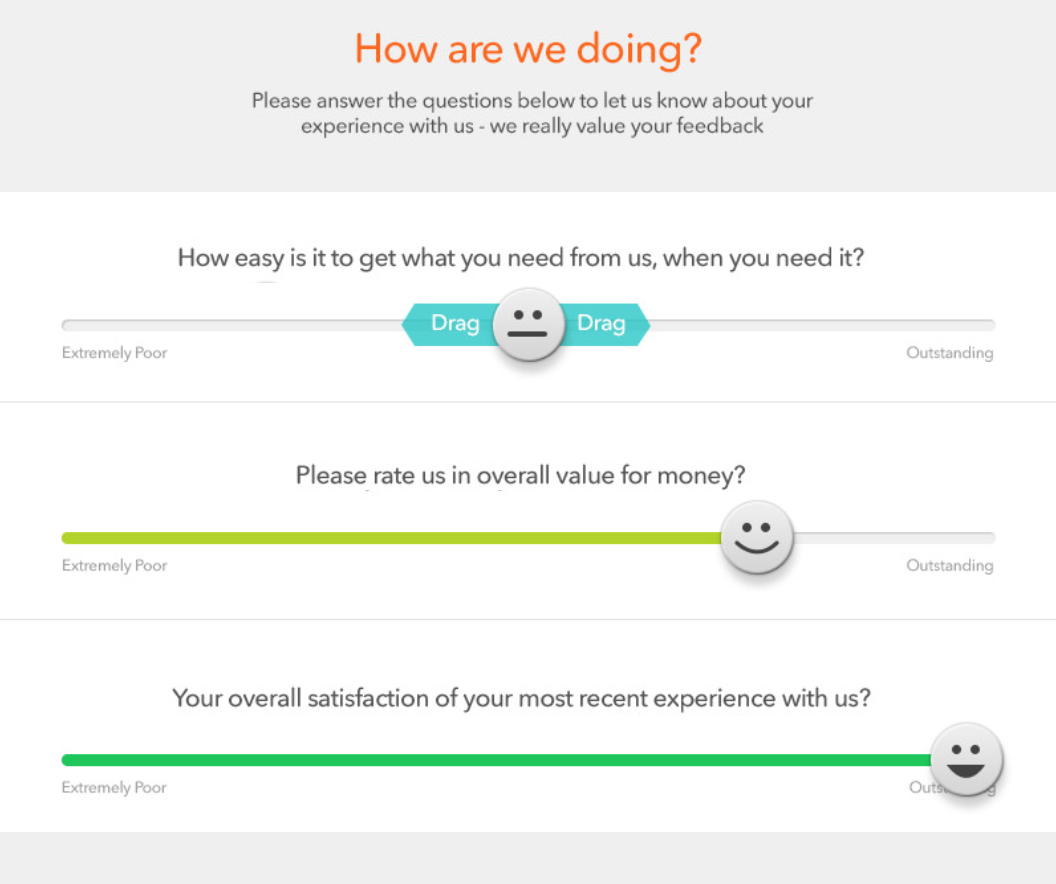
Email Survey: What your customers receive from you
Customers give you feedback by filling out a short email survey
This is the email survey your customers receive.
It’s a series of one or more questions.
Customers answer each on a scale of 1-10, and can make comments.
You choose:
- how many questions
- when to send the surveys
- which customers to send to
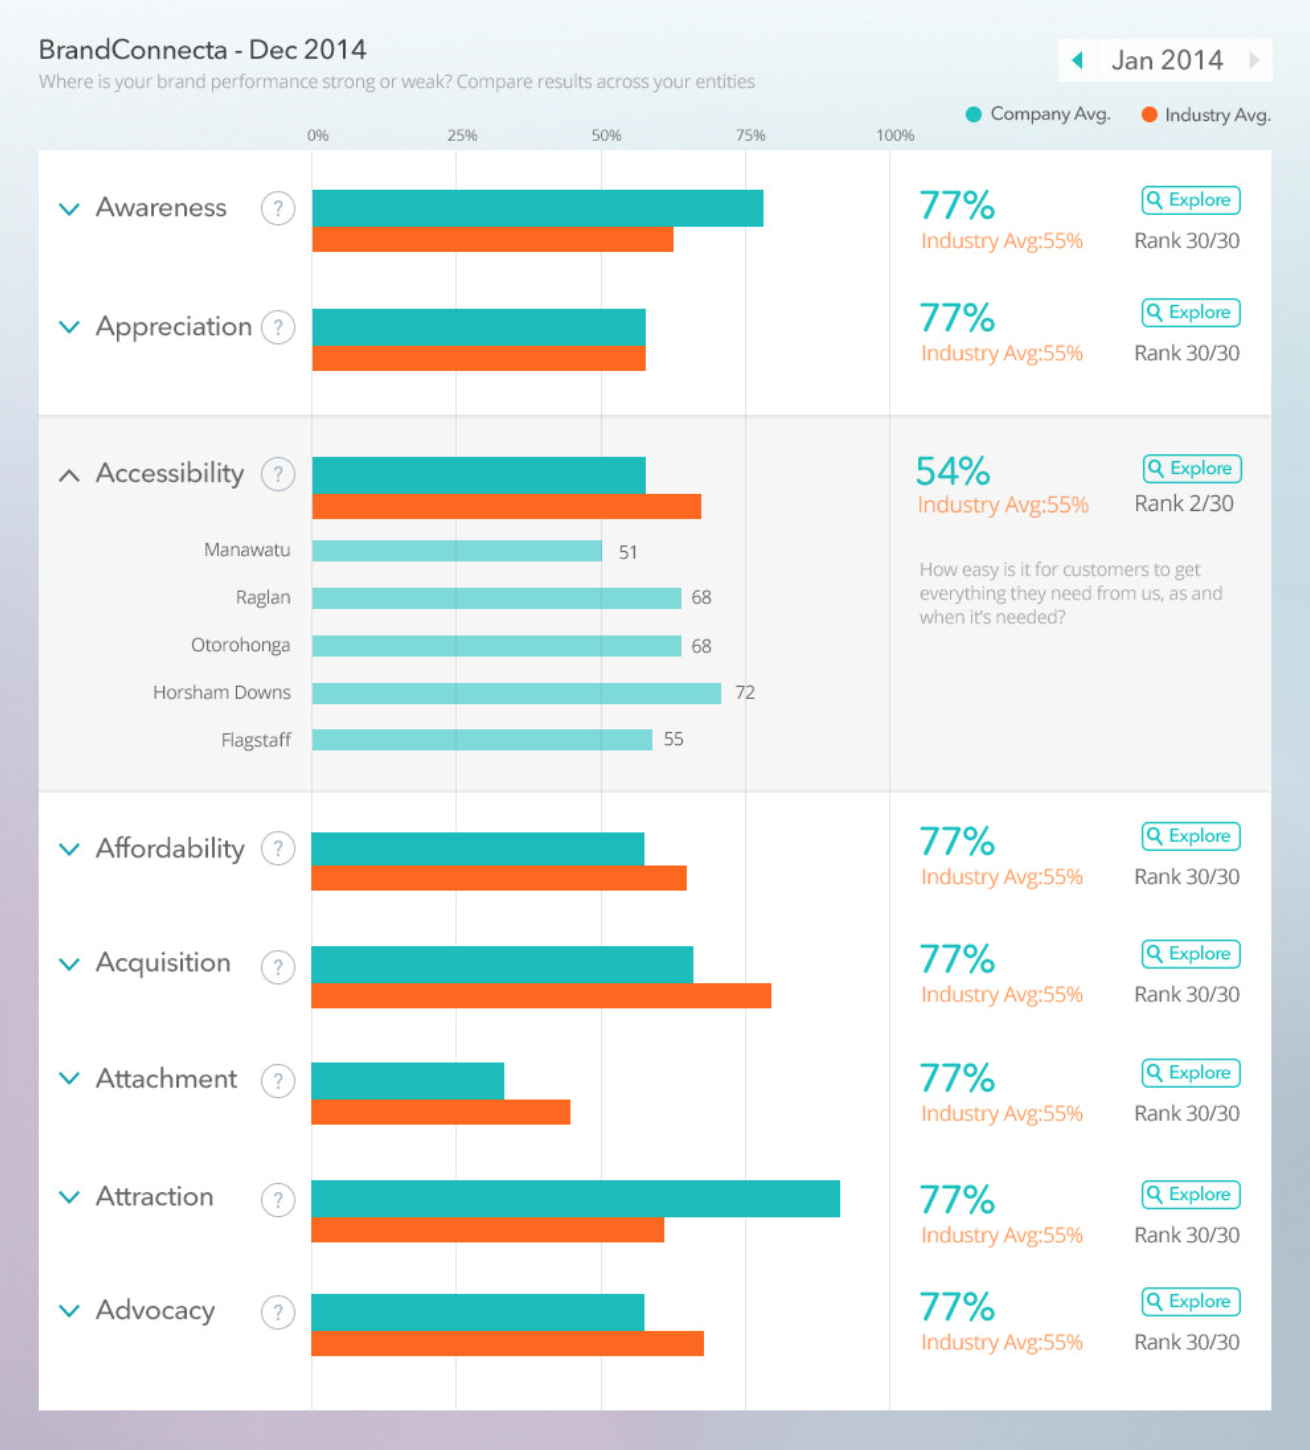
Graph 3: Detailed customer sentiment
More detail is available showing how customers feel about different aspects of your service
Your email surveys can contain multiple questions, each one relating to a different aspect of your service.
As you get more customer feedback on each aspect, you can compare each aspect to your industry’s average.
FEATURE 2:
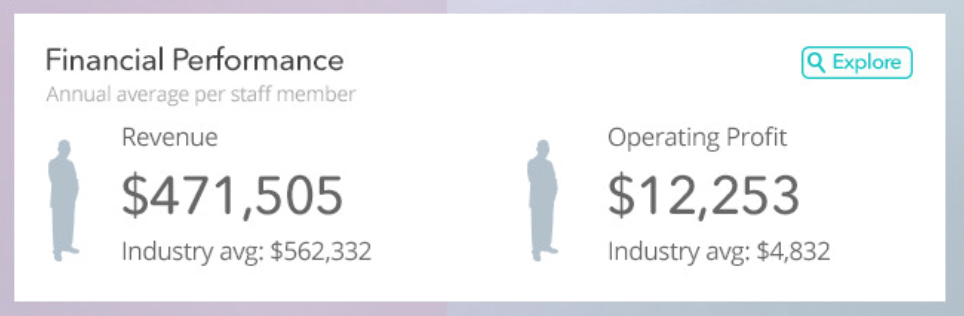
FINANCIAL PERFORMANCE
This chart shows you how your business is performing financially.
Revenue and profit numbers are shown either monthly or annually. They are shown on a “per staff member” basis, to allow large and small companies to be compared.
The tool shows the industry average for each measure, so you can compare how you are doing against your competitors.
It can connect to data from your Xero feed, so you don’t have to do any extra work. If you don’t use Xero, you can get these numbers from your accountant and enter them manually to see how you compare.
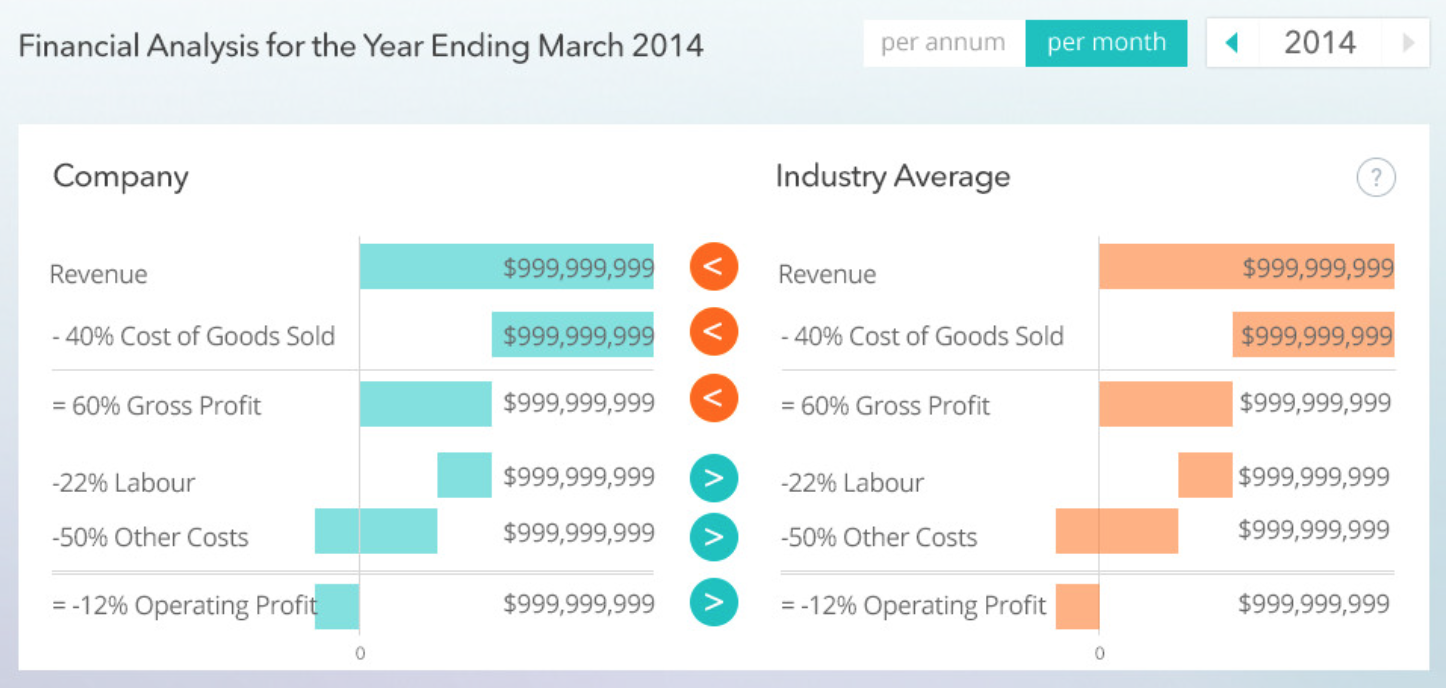
You can “zoom in” to a detailed graph showing your revenue and cost lines
You also get an industry comparison for each of these lines.
Comparison information not currently available in any other tool in the NZ market.